Model uncertainty and model-based control
When Dynamics Models Agree and Still Fail
Within-model noise and between-model disagreement describe different uncertainty. An exact counterexample shows how shared bias escapes the second.
Suppose three predictors agree that a simulated system will move to roughly the same next state. Is that good evidence that a planner should trust the prediction? It is useful evidence, but it is not a certificate. Agreement can reflect a well-supported estimate or a shared blind spot.
PETS uses bootstrapped probabilistic dynamics models and propagates uncertainty while evaluating candidate action sequences. Each member predicts a distribution; variation inside a member and disagreement between members represent different uncertainty sources. Planning executes the first action and then replans with the next observation. The PETS paper, Sections 4–5.
Inspect a mixture before building a planner
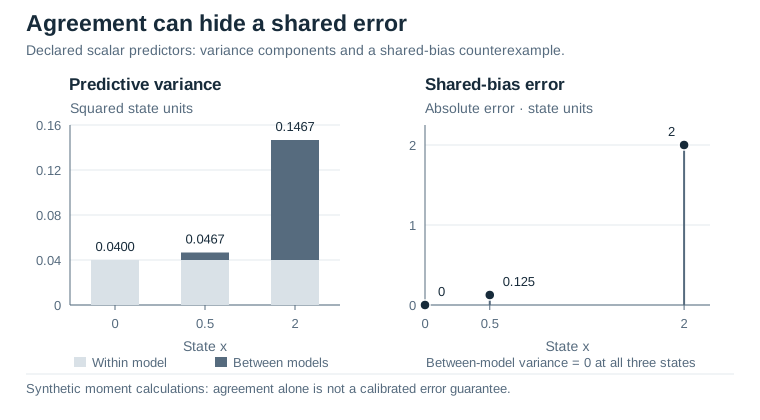
Consider one scalar state x and zero action. Three hand-specified predictors have means 0.8x, 1.0x, and 1.2x. Each predicts variance 0.04. We give the three members equal weight. These are illustrative distributions, not models fitted to a dataset.
The mixture mean is the average of the member means. Its variance decomposes into two quantities:
total variance = average member variance + variance of member means.
To see why, write each outcome's distance from the mixture mean as its distance from its own member mean plus that member mean's displacement. The cross term averages to zero within each member. The remaining squared terms describe within-member spread and between-member spread.
At x = 0.5, the means are 0.4, 0.5, and 0.6. Their variance is (0.01 + 0 + 0.01)/3, approximately 0.00667. Add 0.04 to obtain total variance 0.04667, or standard deviation about 0.216. At x = 2, the means spread to 1.6, 2.0, and 2.4. Between-member variance grows to approximately 0.10667; total standard deviation becomes about 0.383.
The code calculates both components and verifies the answer a second way using second moments. A single uncertainty band would hide their different behavior. Within-model variance stays at 0.04, while between-model variance grows with x because the stipulated slopes disagree. Keeping those components separate reveals which assumption causes the prediction to spread.
A disagreement detector can miss shared bias
Now replace the three slopes with identical slope-one models. They all predict x. Let the simulator's true next-state mean instead be x + 0.5x². At x = 2, the model mean is 2 and the true mean is 4. The error is two units, yet between-model variance is exactly zero.
The second output block exposes this failure without any randomness. More copies of the same misspecified predictor do not fix it. Nor would making its displayed band visually smoother. The toy does not claim that PETS necessarily makes this error; it shows why an ensemble diagnostic must be tested against observed errors rather than accepted by appearance.
For a learned model, calibration needs held-out transitions from both familiar and shifted regions. Compare error with predicted spread: are high-error cases systematically assigned more uncertainty? Keep noise estimation distinct from model disagreement. Multi-step rollouts also matter, because repeatedly applying a locally reasonable model can move a planner into an unsupported region.
Run the example
The Python 3 example uses only the standard library. The notebook, source, figure data and recorded output are included in the complete bundle.
Inspect the code and recorded output
import math

slopes = [0.8, 1.0, 1.2]
member_variance = 0.04

def mixture(x, coefficients):
    means = [coefficient * x for coefficient in coefficients]
    mean = sum(means) / len(means)
    between = sum((value - mean) ** 2 for value in means) / len(means)
    total = member_variance + between
    second_moment = sum(member_variance + value ** 2 for value in means)
    second_moment /= len(means)
    assert abs(total - (second_moment - mean ** 2)) < 1e-12
    return mean, between, total

for x in [0.0, 0.5, 2.0]:
    mean, between, total = mixture(x, slopes)
    print(f"x={x:.1f} mean={mean:.3f} within={member_variance:.5f} "
          f"between={between:.5f} total_sd={math.sqrt(total):.3f}")

print("Shared-bias counterexample:")
for x in [0.5, 2.0]:
    mean, between, total = mixture(x, [1.0, 1.0, 1.0])
    truth = x + 0.5 * x * x
    print(f"x={x:.1f} error={abs(truth - mean):.3f} disagreement={between:.3f}")
    assert between == 0.0
print("Mixture second-moment checks: passed")
Recorded CPU output
x=0.0 mean=0.000 within=0.04000 between=0.00000 total_sd=0.200
x=0.5 mean=0.500 within=0.04000 between=0.00667 total_sd=0.216
x=2.0 mean=2.000 within=0.04000 between=0.10667 total_sd=0.383
Shared-bias counterexample:
x=0.5 error=0.125 disagreement=0.000
x=2.0 error=2.000 disagreement=0.000
Mixture second-moment checks: passed