Why should an LLM server reschedule after every token?
Original CPU scheduler simulation with a constant-cost baseline followed by an occupancy-dependent iteration-cost extension, both without prefill; not an Orca implementation or serving benchmark.
This notebook runs the complete saved experiment, checks its assertions, and regenerates the SVG from the computed results. Python 3.10+ and standard-library modules only. Place experiment.py and figure_generation.py beside the notebook. The exact loaded assets are recorded in notebook metadata.
fixed: A=4, B=1, C=5
iteration: A=4, B=1, C=2
base=1.0 per-active=0.0 fixed: A=4.00, C=4.00 response units
base=1.0 per-active=0.0 iteration: A=4.00, C=1.00 response units
base=0.7 per-active=0.1 fixed: A=3.30, C=3.10 response units
base=0.7 per-active=0.1 iteration: A=3.40, C=1.60 response units
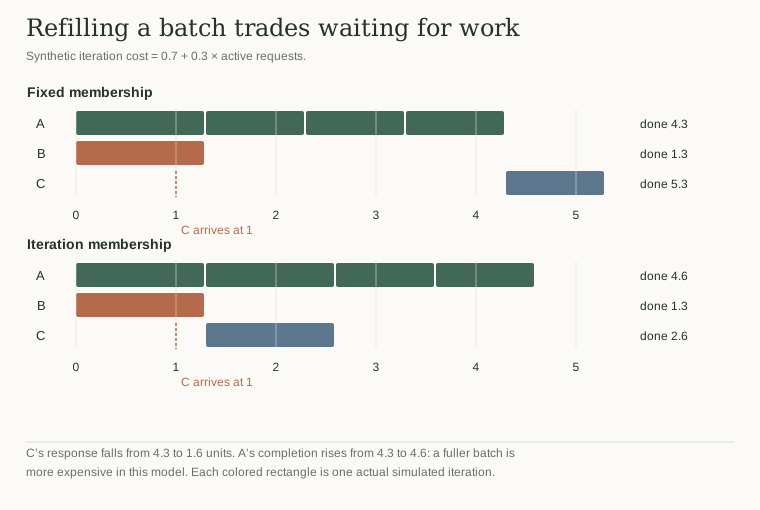
base=0.7 per-active=0.3 fixed: A=4.30, C=4.30 response units
base=0.7 per-active=0.3 iteration: A=4.60, C=1.60 response units
base=0.7 per-active=0.6 fixed: A=5.80, C=6.10 response units
base=0.7 per-active=0.6 iteration: A=6.40, C=2.80 response units
base=0.7 per-active=1.0 fixed: A=7.80, C=8.50 response units
base=0.7 per-active=1.0 iteration: A=8.80, C=4.40 response units
Regenerated figure.svg from results.json.
Inspect the saved result
The article's static figure is available before running code. The regenerated figure.svg uses results.json, and every plotted quantity comes from the experiment.
Change an input in experiment.py, rerun both code cells, then compare the saved result and figure.
Python runs locally in this page. Saved results and figures are visible before execution.