In this article
One system, three different ratios
A throughput number is easier to remember than the conditions that produced it. That makes it tempting to convert an OfflineA benchmark’s rules for how inference requests arrive and how performance is assessed. result into a Server estimate with one discount: perhaps an assumed ten percent for latency constraints. The released MLPerf Inference v6.1 data give a concrete reason to resist that shortcut.
In NVIDIA’s closed-division submission for the DGX B300, the same system metadata appear for three language-model workloads. Each has an Offline row and a Server row. The reported system is one node with eight NVIDIA B300-SXM-270GB accelerators, two Intel Xeon Platinum 8570 host processors, Ubuntu 24.04, and FP4 weights. Within each workload, the entire recorded software string and hardware configuration match.
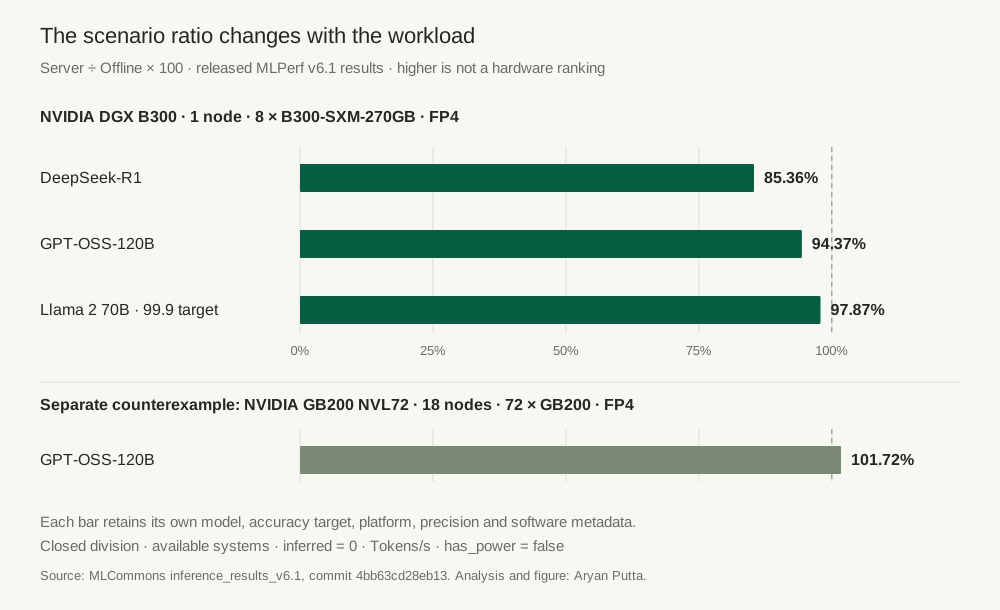
Server throughput is 85.36% of Offline for DeepSeek-R1, 94.37% for GPT-OSS-120B, and 97.87% for Llama 2 70B at its 99.9 accuracy target. The ratios span 12.51 percentage points on this one reported system configuration.
Those percentages summarize released runs. They do not measure a model-independent property of the accelerator, and they do not isolate the effect of changing the arrival process. Workloads, output lengths, accuracy requirements, latency limits, and scenario-specific implementations can all differ. The narrow finding is already useful: one conversion factor does not reproduce these three submitted results.
| Matched workload | Offline | Server | Server / Offline |
|---|---|---|---|
| DeepSeek-R1 | 70,132.3 | 59,867.8 | 85.36% |
| GPT-OSS-120B | 106,637.0 | 100,630.0 | 94.37% |
| Llama 2 70B · 99.9 target | 109,277.0 | 106,949.0 | 97.87% |
| GPT-OSS-120B (GB200 case) | 883,761.0 | 899,005.0 | 101.72% |
The analysis uses the official summary values consistently. The performance logs contain slightly more precision for several Server rates: for example, DeepSeek-R1 records 59,867.76 Tokens/s while the summary reports 59,867.8. All eight highlighted logs say VALID, and their rates agree with the summary within its displayed rounding.
Match the metadata before dividing
The source snapshot contains 492 rows: 476 closed-division and 16 open-division entries. It mixes workloads, scenarios, units, system sizes, availability labels, and the summary’s inferred flag. Sorting all rows by the Result column would combine incompatible quantities, including latency and throughput.
I retain closed, available, datacenter entries with inferred = 0, zero reported errors, Tokens/s units, and either the Offline or Server scenario. I also require has_power = false and no design-power value, matching the scope of this snapshot. This leaves 305 rows. Exactly 304 form 152 complete pairs; one eligible MangoBoost GPT-OSS-120B Offline row has no matching Server row and is left out.
The matching key contains 27 of the summary’s 31 fields. Only Scenario, Result, Accuracy, and Location are allowed to vary. That retains the submitting organization, model and MLPerf model label, full platform and system names, node and accelerator counts, host CPU, framework and operating-system strings, weight precision, availability, division, power fields, notes, and release version. The code rejects duplicate scenarios rather than silently keeping the fastest row.
Accuracy is excluded from equality because it contains the achieved score, not just the target. The target-bearing model label stays in the key; the achieved scores are preserved and checked separately for the highlighted examples. Location varies because each scenario has its own log directory. A metadata match is deliberately stricter than matching just an accelerator name, but still weaker than a controlled experiment with identical serving settings.
The broad pair count is a coverage audit. I do not average the ratios into a universal serving penalty or use them to rank vendors. The B300 case is a focused example with three workloads under one recorded system configuration. The GB200 example below was selected specifically to test the proposed 100% bound. These are exploratory choices made after inspecting the release, not a preregistered sampling design.
The numerator and denominator answer different questions
LoadGen’s documented Offline behavior gives the system a query containing the full sample batch. Server issues single-sample queries with Poisson arrivals and imposes latency constraints. These offer different scheduling opportunities even before a submitter tunes its implementation. For the highlighted language models, the pinned submission-checker constants identify Offline’s metric as tokens per second and Server’s metric as completed tokens per second. LoadGen scenario definitions and the result-field mapping make that distinction explicit.
This is why the ratio is a descriptive comparison between two benchmark modes. It is not GPU utilization, a fraction of requests meeting an application deadline, or a measured cost per token. An Offline throughput result also cannot establish a production time-to-first-token distribution.
Even “Server” is not one universal service-level objective. The checked DeepSeek-R1 logs use a 2,000 ms time-to-first-token limit and an 80 ms time-per-output-token limit. GPT-OSS-120B uses 3,000 ms and 80 ms. Llama 2 70B uses 2,000 ms and 200 ms. The notebook checks those actual log parameters against the separately pinned MLCommons constants. It does not substitute the much tighter Interactive scenario for Server.
Keep the accuracy requirement attached
The suffix in llama2-70b-99.9 matters. In the checked v6.1 constants, its three ROUGE thresholds are 99.9% of the respective reference scores. It is not a claim that the model answers 99.9% of questions correctly. The target also includes a minimum average output-token count. DeepSeek-R1 has an exact-match and token-length requirement; GPT-OSS-120B has an exact-match requirement.
| Workload | Accuracy threshold(s) | Minimum tokens/sample |
|---|---|---|
| DeepSeek-R1 | Exact match ≥ 80.544618 | 3,497.60466 |
| GPT-OSS-120B | Exact match ≥ 82.2987 | No token-length threshold in this target tuple |
| Llama 2 70B · 99.9 | ROUGE-1 ≥ 44.3867688 ROUGE-2 ≥ 22.0131648 ROUGE-L ≥ 28.5875838 | 265.005 |
All eight highlighted summary rows clear their corresponding thresholds. That is a check of reported metrics against published constants, not a fresh accuracy evaluation. No model was loaded and no predictions were regenerated. The released scores differ slightly between scenarios, so treating the accuracy strings as identical would incorrectly discard valid comparisons.
Inspect the achieved scores without dropping a scenario
| Workload | Offline accuracy | Server accuracy |
|---|---|---|
| DeepSeek-R1 | exact_match: 80.78851412944394 TOKENS_PER_SAMPLE: 3793.9359617137648 | exact_match: 81.17593436645396 TOKENS_PER_SAMPLE: 3818.7203737465816 |
| GPT-OSS-120B | exact_match: 83.430 | exact_match: 83.702 |
| Llama 2 70B · 99.9 target | ROUGE1: 44.7951 ROUGE2: 22.3759 ROUGEL: 29.1534 TOKENS_PER_SAMPLE: 272.8 | ROUGE1: 44.8452 ROUGE2: 22.4177 ROUGEL: 29.2149 TOKENS_PER_SAMPLE: 272.7 |
| GPT-OSS-120B (GB200 case) | exact_match: 84.038 | exact_match: 83.914 |
The shared framework field lists TensorRT 10.14, CUDA 13.1, cuDNN 9.17, TensorRT-LLM feat/1.2-mlpinf, NVIDIA Dynamo mlperf-v6.0-dynamo-v0.8.0, and vLLM CentML:mlperf-inf-mm-q3vl-v6.1. This system-level list is preserved as submitted. It should not be read as evidence that every listed component participates in every workload.
A released ratio can exceed 100%
The NVIDIA GB200 NVL72 GPT-OSS-120B pair reports 883,761 Tokens/s Offline and 899,005 Tokens/s Server. Dividing the latter by the former gives 101.72%. This is an 18-node system with four NVIDIA GB200 accelerators per node, 72 total, two NVIDIA Grace CPUs per node, FP4 weights, Ubuntu 24.04, and the same framework string within the pair. It is not the eight-accelerator B300 system.
The example disproves a simple descriptive claim: the released Server column is not always less than or equal to its metadata-matched Offline column. Across the full eligible set, 11 of 152 pairs exceed 100%. Those pairs are a collection of submissions, not independent samples from a hardware population. The count is not an estimate of how often Server will outperform Offline in a new deployment.
It also does not establish that the Server scenario is inherently faster. The summary does not prove that either submitted run is the maximum achievable performance of that system, or that scenario-specific tuning is identical. It supplies no repeated-run variance for this calculation. Without paired reruns and implementation inspection, a small reversal should remain a property of the submitted numbers rather than become a causal story.
The missing power measurement is part of the result
Every row in this snapshot has has_power = false, and every design_power_watts value is null. The B300 notes mention a 1,100 W TGP setting; the GB200 notes mention 1,200 W TGP per GPU. Those notes are retained in the match. Neither is a measured system-power result, and multiplying a TGP value by accelerator count would not establish wall-plug energy during these runs.
Accordingly, this analysis makes no energy-efficiency, cost-efficiency, or purchasing recommendation. It does not divide throughput by a guessed power draw or price. It also leaves out inferred rows, preview and RDI availability labels, open-division modifications, non-datacenter cases, and mismatched units rather than quietly mixing them into a larger chart.
A deployment decision would need another experiment: the intended model and quality target, actual prompt and output-length mix, identical serving software where feasible, an arrival process and latency objective that reflect the application, repeated runs, and measured system power if energy matters. These released rows are useful evidence for choosing what to test. They do not replace that experiment.
Recompute the finding without a GPU
The bundle contains the byte-identical official CSV and JSON, all eight highlighted performance summaries, the pinned rules files, an executed notebook, the original SVG generator, and a standard-library Python analysis. There are no API calls, remote scripts, model weights, or paid services. The article’s figure is inline SVG, so the result remains visible without running code.
Download and inspect
- Complete reproducibility bundle
- Executed notebook and analysis script
- Eight highlighted source rows and all 152 matched-pair results
- Original SVG and figure generator
- Source hashes and immutable revisions, upstream Apache-2.0 license, and reproduction instructions
From the extracted folder, run python analyze.py, then python make_plot.py. Run python execute_notebook.py to reproduce the notebook’s saved outputs with Python alone. An installed Jupyter environment can also run the notebook normally.
The checks cover all 492 CSV/JSON row pairs, Git-blob and SHA-256 source identity, exact metadata equality within matched pairs, rejection of duplicate scenarios and mismatched conditions, highlighted accuracy thresholds, actual latency-limit settings, and log-to-summary rounding. The rules file is parsed as data; upstream Python is not executed. The notebook uses the supplied files and runs offline.
The practical conclusion is modest: retain the model, accuracy target, scenario, system configuration, and measurement boundary before interpreting a throughput ratio. In these released runs, the ratio varies materially within one system and is not even bounded by 100% across all submitted pairs. That is more useful than a leaderboard stripped of its conditions.
Sources and provenance
- MLCommons, MLPerf Inference v6.1 summary.json and summary.csv. Results commit
4bb63cd28eb136be221bc801a9e38c66c8a7553f. NVIDIA is the submitter for the highlighted rows; measurements were not independently rerun for this article. - Eight NVIDIA performance logs at the same results revision, linked from the throughput table and included unchanged in the bundle. Row IDs are 285–290 and 300–301 in the pinned JSON.
- MLCommons submission-checker constants and LoadGen scenario definitions. Documentation revision
3fbc329939999c13d0a7b5e67fb2092287e06047, separately pinned from the results release. - Vijay Janapa Reddi et al., MLPerf Inference Benchmark (2019). Foundational benchmark description; the released v6.1 data and pinned rules, not the original paper’s workload set, govern the calculations here.
- Repository Apache License 2.0. Included source files are unchanged and attributed to MLCommons and the respective submitters. MLPerf is a registered trademark of MLCommons. This analysis is not endorsed by MLCommons or any submitter.
Source retrieval: November 6, 2026 (UTC). This records the data acquisition, not a publication date. The complete file hashes and acquisition scope are in the provenance manifest.