How do microbatches change pipeline idle time?
Original flush-style forward/backward CPU schedule model; durations are synthetic and exclude communication and recomputation.
This notebook runs the complete saved experiment, checks its assertions, and regenerates the SVG from the computed results. Python 3.10+ and standard-library modules only. Place experiment.py and figure_generation.py beside the notebook. The exact loaded assets are recorded in notebook metadata.
balanced m=1: time=8, utilization=0.250
balanced m=4: time=14, utilization=0.571
balanced m=16: time=38, utilization=0.842
imbalanced m=1: time=10, utilization=0.250
imbalanced m=4: time=22, utilization=0.455
imbalanced m=16: time=70, utilization=0.571
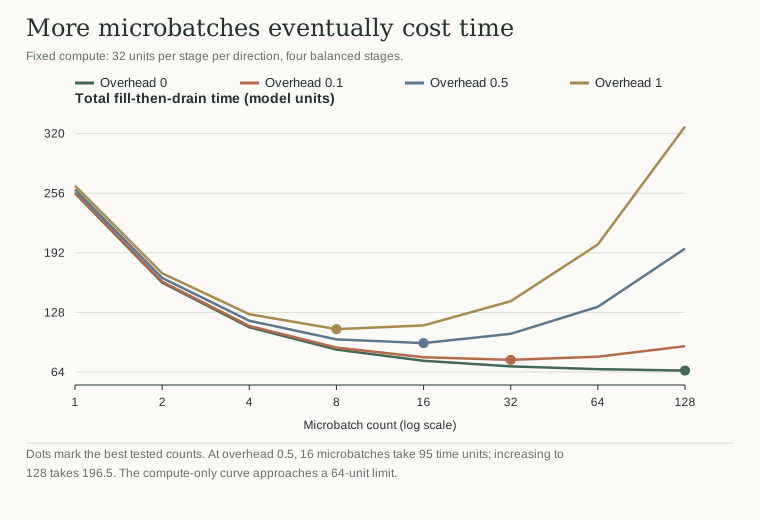
per-operation overhead=0.0: best tested microbatches=128, elapsed=65.500
per-operation overhead=0.1: best tested microbatches=32, elapsed=77.000
per-operation overhead=0.5: best tested microbatches=16, elapsed=95.000
per-operation overhead=1.0: best tested microbatches=8, elapsed=110.000
Regenerated figure.svg from results.json.
Inspect the saved result
The article's static figure is available before running code. The regenerated figure.svg uses results.json, and every plotted quantity comes from the experiment.
Change an input in experiment.py, rerun both code cells, then compare the saved result and figure.
Python runs locally in this page. Saved results and figures are visible before execution.