A request waits for every worker in a parallel computation. Each worker usually finishes quickly. Why does the whole request so often feel slow? The answer is that completion depends on a maximum, not an average. Adding workers adds opportunities to encounter an unusually large latency.
The Tail at Scale explains how component-level latency variation becomes service-level delay under fan-out, and discusses ways to tolerate those tails rather than assuming every component can be made uniformly fast. Dean and Barroso, component variability and within-request mitigation sections.
The Tail at Scale includes a service example with p99 latency of 10 ms for one random leaf, 140 ms when waiting for all leaves, and 70 ms when waiting for 95% of them. Those observed values are distinct from the exponential distribution below. They illustrate why both the joint latency behavior and the completion rule belong in an end-to-end service analysis.
Start with an explicit probability model
Let each worker's completion time have cumulative distribution F(t). If n worker times are independent and identically distributed, all n finish by t with probability F(t)^n. Therefore the request exceeds t with probability 1 − F(t)^n.
Suppose a worker exceeds a chosen deadline on 1% of requests. Ten independent workers exceed that deadline collectively with probability 1 − 0.99¹⁰, about 9.56%. For 100 workers the probability is approximately 63.4%. These are probabilities for our hypothetical system, not observations from a deployed service.
The same calculation turns a service-level target into a component-level requirement. To make 99% of 100-worker requests finish by a deadline, each independent worker needs F(t) ≥ 0.99^(1/100), approximately 0.9998995. That is a much stricter requirement than asking each component to meet its own p99 target at the same deadline.
Compute a continuous p99 without sampling
For a second original example, choose exponentially distributed worker latency with mean ten milliseconds. Then F(t) = 1 − exp(−t/10). Solving F(t)^n = 0.99 yields the request p99:
t₉₉ = −10 log(1 − 0.99^(1/n)).
The code evaluates this expression directly and substitutes the result back into the distribution as a numerical check. It also prints the component probability required by each fan-out size. No random seed or Monte Carlo sampling error is involved. This is a distribution calculation, not a performance benchmark.
Correlation is not simply an extra multiplier
Now imagine perfect shared delay: all workers have exactly the same latency on a given request while retaining the same individual distribution. The maximum equals that common latency. Its p99 no longer grows with n. Likewise, if all workers share the same 1%-probability slow event, the probability that at least one is slow stays 1%, rather than growing toward one.
That does not make correlated failures desirable. In the shared-delay case, many workers are slow simultaneously, and sending a duplicate to another worker with the same cause may not help. The point is narrower: with marginal distributions fixed, independence and common-mode dependence produce different maximum distributions. “Correlation makes the tail worse” is not a sufficient model specification.
Independent and perfectly shared cases are separate assumptions, not measurements before and after an optimization. A realistic study would inspect joint latencies, shared queues, and request-level conditions instead of fitting only one marginal histogram.
Finally, confirm the completion rule. Waiting for every worker creates a maximum; waiting for a quorum creates a different order statistic. Returning partial results changes the product requirement as well as the formula. Before optimizing a tail, write down precisely which responses the user must wait for.
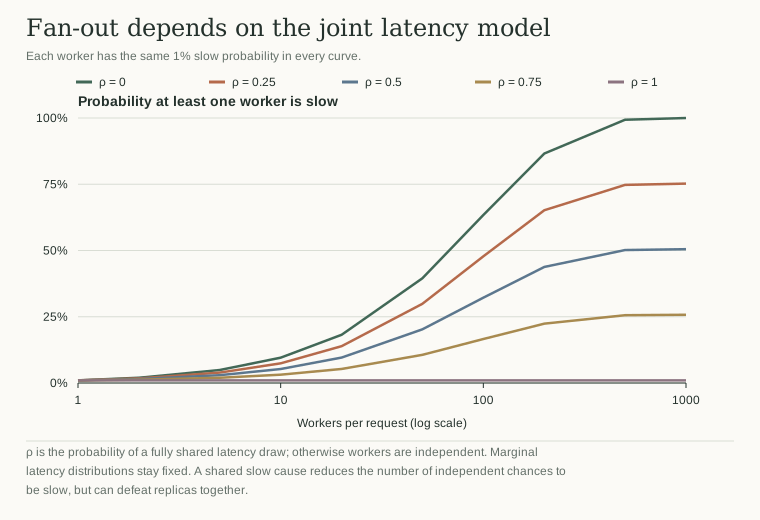
Keep the marginals fixed while changing dependence
The extended calculation interpolates between independence and a fully shared delay. With probability ρ, all workers receive one common latency draw; otherwise they receive independent draws. Every worker retains the same marginal distribution at every ρ. For a slow-event probability p, the request-level probability is ρp + (1 − ρ)[1 − (1 − p)ⁿ].
At n = 100 and p = 0.01, the independent case is about 63.4%, the half-shared mixture is about 32.2%, and the fully shared case is 1%. This ordering is about a maximum with fixed marginals. It is not evidence that shared infrastructure failures improve reliability. A common cause can make all replicas fail together, undermining the mitigation that independent alternatives would have supplied.
For exponential latency, the mixture request CDF is ρF(t) + (1 − ρ)F(t)ⁿ. The notebook inverts this expression by bisection for fifty fan-out/dependence settings and substitutes each computed p99 back into the CDF. All reconstructions agree with 0.99 within 10⁻¹⁰. This verifies the numerical inversion separately from the modeling assumption.
A useful production trace should therefore preserve worker identities within each request. Pooling all worker observations into one histogram discards the joint information needed to distinguish these cases. Similarly, a hedging experiment must report extra load and shared failure domains, not only the faster of two sampled completions.