Why does one slow server matter more as a service grows?
Exact maximum-distribution and percentile calculations for hypothetical independent and perfectly shared latencies; no production-service measurements.
This notebook runs the complete saved experiment, checks its assertions, and regenerates the SVG from the computed results. Python 3.10+ and standard-library modules only. Place experiment.py and figure_generation.py beside the notebook. The exact loaded assets are recorded in notebook metadata.
n=   1 independent_any_slow=0.010000 shared_any_slow=0.010000
  exponential_p99_ms: independent=46.052 shared=46.052; required_component_CDF=0.99000000
n=  10 independent_any_slow=0.095618 shared_any_slow=0.010000
  exponential_p99_ms: independent=69.032 shared=46.052; required_component_CDF=0.99899547
n= 100 independent_any_slow=0.633968 shared_any_slow=0.010000
  exponential_p99_ms: independent=92.054 shared=46.052; required_component_CDF=0.99989950
n=1000 independent_any_slow=0.999957 shared_any_slow=0.010000
  exponential_p99_ms: independent=115.079 shared=46.052; required_component_CDF=0.99998995
CDF inversion and n=1 checks: passed
50 mixture cases inverted by bisection; each reconstructed service CDF equals 0.99 within 1e−10.
Regenerated figure.svg from results.json.
Inspect the saved result
The article's static figure is available before running code. The regenerated figure.svg uses results.json, and every plotted quantity comes from the experiment.
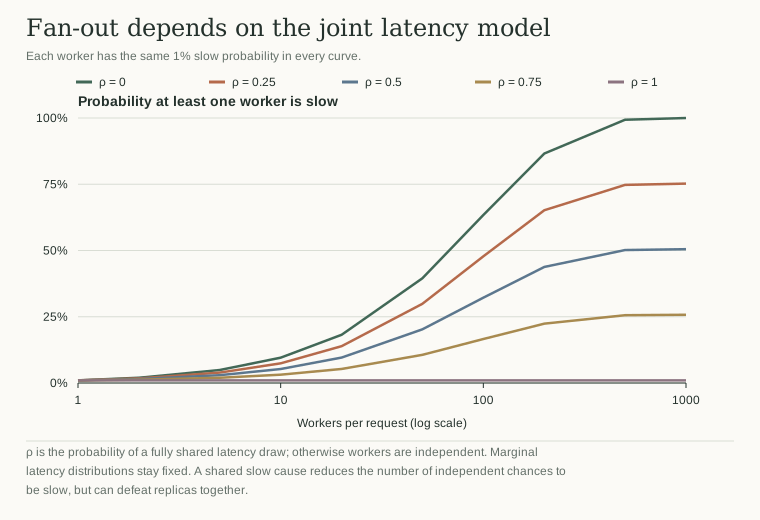
Change an input in experiment.py, rerun both code cells, then compare the saved result and figure.
Python runs locally in this page. Saved results and figures are visible before execution.