Research / Agent systems
When benchmark averages reverse an agent ranking
An 83% overall score can lose to 80% under equal family weighting. The crossover can be calculated rather than argued over.
Suppose policy A wins an aggregate evaluation with 83% success, while policy B reaches 80%. Before choosing A, ask what was counted. If A fails every task in a family that matters to the user, its three-point overall lead may be irrelevant. An average is a summary of a particular mixture, not a universal capability ranking.
Inspect a case
Scores encode weighting decisions
AgentBench evaluates multiple environment families and explicitly addresses their different score scales. Its overall score uses fixed normalization weights derived from the evaluated models' average scores, rather than a plain unweighted average of raw task outcomes. The example here studies simpler macro and micro averagesAn aggregate that pools individual task outcomes, giving each task equal weight. to make weighting effects visible; it does not reproduce AgentBench's official aggregate. AgentBench, Section 4.1
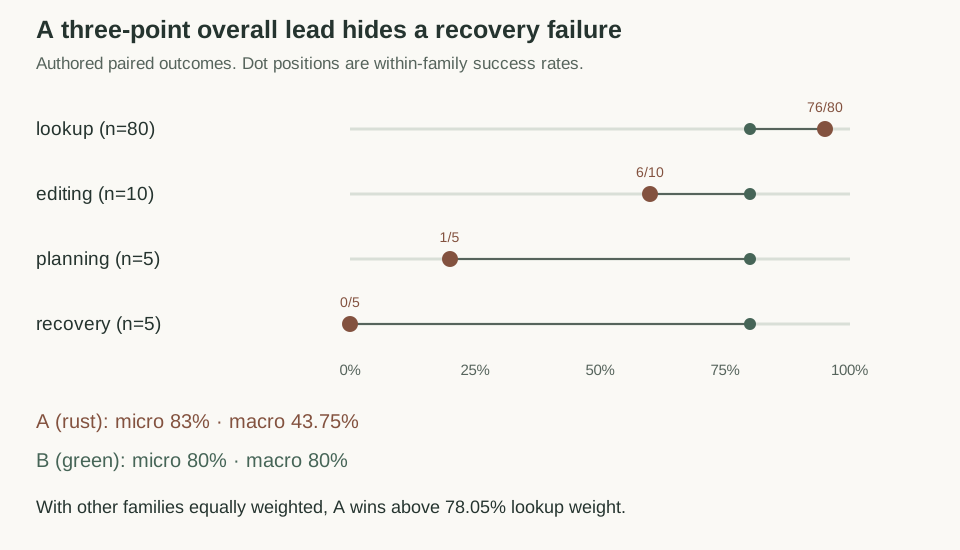
Four synthetic task families contain 80 lookup tasks, 10 editing tasks, 5 planning tasks, and 5 recovery tasks. Policy A succeeds on 76, 6, 1, and 0 respectively. Policy B succeeds on 64, 8, 4, and 4. These are authored fixture labels, not measurements from language models.
A micro average counts every task equally. A therefore gets (76 + 6 + 1 + 0)/100 = 0.83, beating B's 0.80. A macro averageAn aggregate that computes each group’s score and then weights groups equally. first computes each family rate, then weights the four families equally. A gets (0.95 + 0.60 + 0.20 + 0)/4 = 0.4375. B stays at 0.80. The ranking reverses because eighty easy lookup tasks no longer dominate the denominator.
Find the crossover instead of arguing over one mixture
Let w be the weight assigned to lookup, with the remaining weight divided equally among the other three families. A's weighted score is 0.95w + 0.2667(1−w), while B's is 0.80 for every w in this construction. A wins only when w exceeds approximately 0.7805. The empirical micro mixture also assigns lookup weight 0.8, although it splits the remaining weight 0.10/0.05/0.05 rather than equally. The sweep is an alternate workload family, not an exact reconstruction of that empirical mixture.
Neither weighting rule is inherently dishonest. Micro weighting is appropriate if the task sample represents the intended workload. Macro weighting is useful when each family deserves equal emphasis. The problem is presenting either number without its sampling assumptions, or selecting weights after seeing which policy they favor.
The code also performs a paired, stratified bootstrap for the macro-score difference. It resamples matched task rows within each family, preserving the family sizes and which policy succeeded on each synthetic case. This is different from resampling families: it estimates within-family task uncertainty while holding the four chosen families fixed.
A zero is more informative than its contribution to an average
A fails all five recovery fixtures. Five failures do not prove a zero success probability over every possible recovery task, but they identify a concrete unsupported capability in this set. An aggregate should not make that fact difficult to discover. Report family counts alongside rates so a 0/5 result is not visually confused with 0/500.
The fixture's paired outcomes are deliberately simple and correlated: successes occupy the first rows in each family. Bootstrap results inherit that construction. They illustrate the resampling procedure rather than establishing uncertainty for a real product decision.
Show what the aggregate leaves out
The sensitivity sweep records 101 lookup weights, while the paired data and all 1,000 bootstrap differences remain available for inspection. The analytic crossover is 32/41, or approximately 78.05%. At exactly that weight the two policies tie; either side selects a different winner.
The recovery count is the more immediate deployment question. A policy with zero successes in five recovery fixtures has not demonstrated that behavior in this set, regardless of its lookup score. Adding more lookup tasks can raise confidence in lookup performance but supplies no new recovery evidence. A scorecard should make that asymmetry visible before a workload-weighted aggregate is used for a decision.
Read the tested Python and recorded output
"""When benchmark averages reverse an agent ranking
Deterministic, standard-library experiment. RESULTS contains the full data.
"""
from random import Random
counts = [('lookup', 80, 76, 64), ('editing', 10, 6, 8),
          ('planning', 5, 1, 4), ('recovery', 5, 0, 4)]
rows = {name: [(int(i < a), int(i < b)) for i in range(n)]
        for name, n, a, b in counts}

def macro(data, policy):
    return sum(sum(row[policy] for row in group) / len(group)
               for group in data.values()) / len(data)

for policy, name in enumerate(('A', 'B')):
    micro = sum(row[policy] for group in rows.values() for row in group) / 100
    print(name, f'micro={micro:.4f}', f'macro={macro(rows,policy):.4f}')
for name, n, a, b in counts:
    print(name, f'A={a}/{n}', f'B={b}/{n}')
for weight in (0, 0.25, 0.5, 0.75, 1):
    a = 0.95 * weight + ((0.6 + 0.2 + 0) / 3) * (1-weight)
    print(f'lookup_weight={weight:.2f}', f'A={a:.3f}', 'B=0.800')

rng = Random(35)
differences = []
for _ in range(1000):
    sample = {name: [rng.choice(group) for _ in group] for name, group in rows.items()}
    differences.append(macro(sample, 0) - macro(sample, 1))
differences.sort()
print('macro_A_minus_B_bootstrap_95pct',
      f'[{differences[24]:.3f},{differences[974]:.3f}]')
crossover = (0.8 - 0.8/3) / (0.95 - 0.8/3)
print('lookup_weight_crossover', f'{crossover:.4f}')
assert abs(macro(rows, 0) - 0.4375) < 1e-12


RESULTS=dict(families=[dict(name=n,tasks=t,A=a,B=b,A_rate=a/t,B_rate=b/t) for n,t,a,b in counts],paired_rows=rows,bootstrap_differences=differences,crossover=crossover,micro={'A':.83,'B':.80},macro={'A':macro(rows,0),'B':macro(rows,1)},sensitivity=[dict(lookup_weight=i/100,A=.95*i/100+(.8/3)*(1-i/100),B=.8) for i in range(101)])
assert abs(crossover-32/41)<1e-12
print('Analytic crossover: 32/41')
Recorded output
A micro=0.8300 macro=0.4375
B micro=0.8000 macro=0.8000
lookup A=76/80 B=64/80
editing A=6/10 B=8/10
planning A=1/5 B=4/5
recovery A=0/5 B=4/5
lookup_weight=0.00 A=0.267 B=0.800
lookup_weight=0.25 A=0.438 B=0.800
lookup_weight=0.50 A=0.608 B=0.800
lookup_weight=0.75 A=0.779 B=0.800
lookup_weight=1.00 A=0.950 B=0.800
macro_A_minus_B_bootstrap_95pct [-0.506,-0.203]
lookup_weight_crossover 0.7805
Analytic crossover: 32/41