Why can a bigger network buffer make an application slower?
A sampled persistence detector, queue-drain arithmetic, and separate control-law spacing calculation; not full CoDel, a responsive TCP simulation, or a Linux benchmark.
This notebook runs the complete saved experiment, checks its assertions, and regenerates the SVG from the computed results. Python 3.10+ and standard-library modules only. Place experiment.py and figure_generation.py beside the notebook. The exact loaded assets are recorded in notebook metadata.
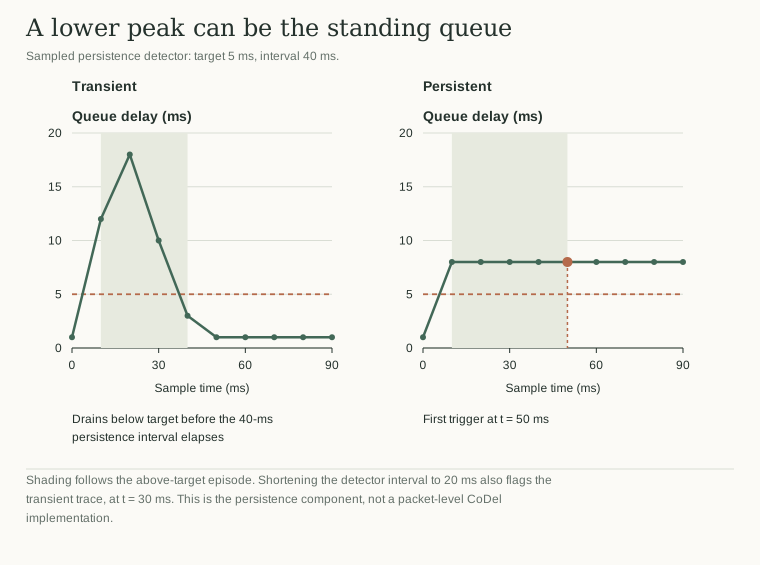
transient: peak=18ms first_persistent=None
persistent: peak=8ms first_persistent=50
queued_bytes=40000: drain_time=32.0ms
queued_bytes=1000000: drain_time=800.0ms
Illustrative successive signal spacings (ms): [40.0, 28.28, 23.09, 20.0]
Transient trace triggers with a 20 ms interval (at 30 ms), but not with a 40 ms interval.
The persistence interval changes the question; peak delay alone cannot answer it.
Regenerated figure.svg from results.json.
Inspect the saved result
The article's static figure is available before running code. The regenerated figure.svg uses results.json, and every plotted quantity comes from the experiment.
Change an input in experiment.py, rerun both code cells, then compare the saved result and figure.
Python runs locally in this page. Saved results and figures are visible before execution.